- REAGENT SERVICES Hot!
-
PRODUCTS
-
 Most Popular Products
-
 Antibodies
-
ELISA Kits
-
 Protein Electrophoresis and Blotting
-
Protein and Antibody Purification
-
Recombinant Proteins
-
 Molecular Biology
-
 Stable Cell Lines
-
 Cell Isolation and Activation
-
 IVD Raw Materials
-
 Therapy Applications
-
 Online Shop
-
Resources
-
![AmMag™ Quatro Automated Plasmid Purification]() AmMag™ Quatro automated plasmid purification
AmMag™ Quatro automated plasmid purification
-
![Anti-Camelid VHH]() MonoRab™ Anti-VHH Antibodies
MonoRab™ Anti-VHH Antibodies
-
![Precast Gels]() SurePAGE™ Precast Gels
SurePAGE™ Precast Gels
-
![Quatro ProAb Automated Protein and Antibody Purification System]() AmMag™ Quatro ProAb Automated Protein and Antibody Purification System
AmMag™ Quatro ProAb Automated Protein and Antibody Purification System
-
![Target Proteins]() Target Proteins
Target Proteins
-
![AmMag™ Quatro Automated Plasmid Purification]() AmMag™ Quatro automated plasmid purification
AmMag™ Quatro automated plasmid purification
-
![Quick
Order]() Quick Order
Quick Order
-
![Quick
Order]() Quick Order
Quick Order
- APPLICATIONS
- RESOURCES
- ABOUT US


Overview
GenScript’s Comprehensive Protein Analysis Platform is an advanced, integrated system designed for in-depth study and evaluation of protein characteristics. It offers a wide range of services, including qualitative & quantitative analysis, protein modification analysis, impurity analysis, molecular interaction analysis, and more customized analysis. Together, these capabilities make the platform an essential tool in protein research, drug development, and biopharmaceutical production.

Qualitative & Quantitative Analysis
- Concentration
- Purity (SDS-PAGE, CE-SDS, icIEF, SEC-HPLC, RP-HPLC, HIC-HPLC, etc.)
- Intact mass /Native mass
- (in gel) Peptide mapping
- N/C terminal sequencing

Protein Modification Analysis
- PTM analysis
- Disulfide bond mapping
- N-glycan and O-glycan profiling
- Sialic acid analysis

Impurity
Analysis- Endotoxin quantification
- HCP identification /quantification
- Residual DNA quantification
- Residual Protein A quantification

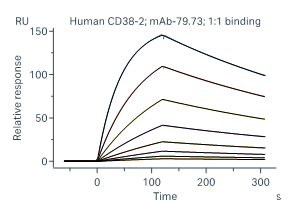
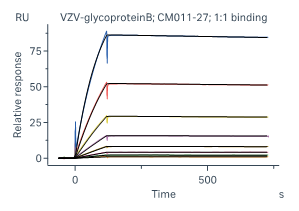
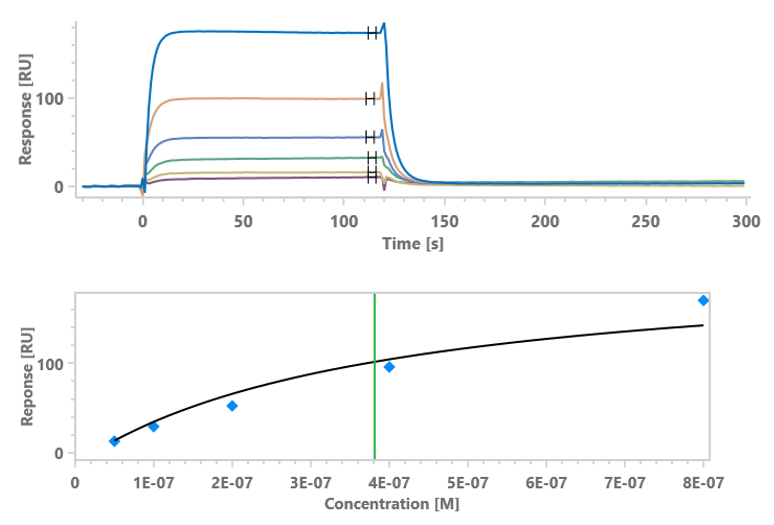
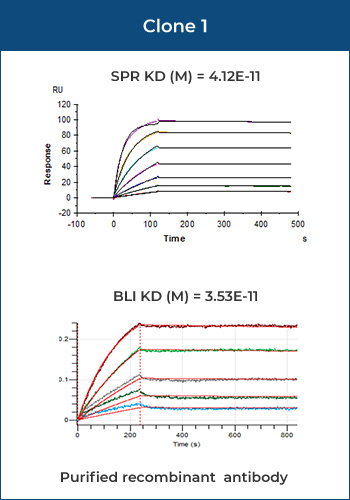
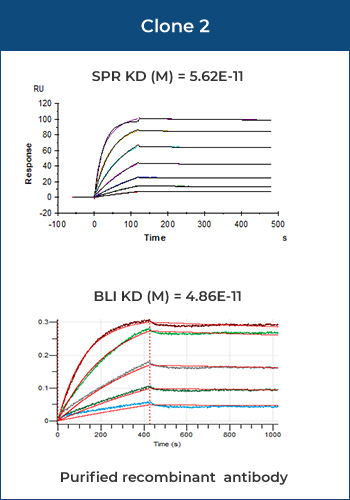
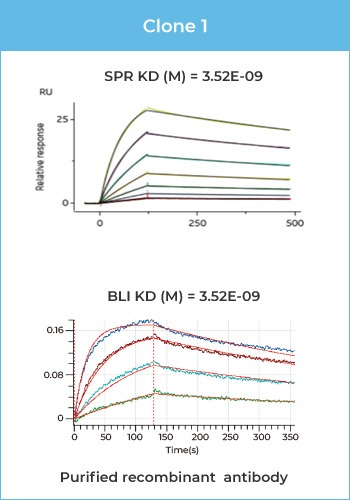
Molecular Interaction
Analysis- Antibody-antigen affinity analysis >>
- Protein-protein/DNA /small molecule interactions
- Fc effector function
- Enzyme activity assay

Customized
Analysis- Monoclonal antibody self-interactions
- Monoclonal antibody polyspecificity
- Thermal stability analysis
- Mutation site analysis
- Free-thaw stability analysis
- Antibody de novo sequencing
- More customized services available
Advanced instruments for protein analysis
Waters BioAccord LC-MS
Thermo QE Orbitrap LC-MS/MS
Waters Xevo G3 QTOF
Biacore 8K
Octet RED
qPCR
Plate reader
TR-FRET
LabChip CE-SDS
Maurice iCIEF
Agilent GC
Cedex analyzer
Waters UPLC
Optimize Your Research with Precision-Fit Assays
Identify your research stage and discover tailored services to accelerate your progress!
 Antibody Drug DiscoveryGene to HitsHits to LeadsCandidates SelectionDiscovery & Target
IdentificationHits ScreeningLead Indentifaction
& ValidationLead OptimizationIn vivo & vitro AssaysGLP Tox0.05mg500mg1g200gTurboCHO™ HTTurboCHO™ ExpressTurboCHO™ HP/TurboCHO™ StableQualitative & Quantitative Analysis
Molecular Interaction Analysis- Purity by CE-SDS or HPLC
- Affinity screening/ranking >>
- HT antibody stability screening
- More customized services available
Qualitative & Quantitative
Analysis- Purity by HPLC
- Intact mass
- Peptide mapping
- N/C terminal sequencing
- More customized
services available
Protein Modification & Molecular
Interaction Analysis- Identification by mass
- PTM analysis
- Disulfide bond mapping
- N-/O- glycan profiling
- Sialic acid analysis
- Fc binding affinity >>
- More customized services available
 In Vitro Diagnostic DevelopmentTarget ScreeningAssay DevelopmentAssay Validation and OptimizationDiagnostic
CommercializationBiomarker
DiscoveryReplication
Confirm markers and reproducibility of assaysAnalytical Development
Translation onto a clinical diagnostic platformPhase I
Sensitivity & SpecificityPhase II
PPV and NPVPhase III
Clinical benefit
& Cost effectivenessRegistration0.05mg500mg1g10gTurboCHO™ HTTurboCHO™ ExpressTurboCHO™ HP/TurboCHO™ StableTurboCHO™ StableQualitative & Quantitative Analysis
Molecular Interaction- Purity by CE-SDS or HPLC
- Affinity screening/ranking >>
- More customized services available
Protein Modification & Molecular Interaction Analysis
- Identification by mass
- PTM analysis
- Glycan analysis
- Binding affinity assay >>
- More customized services available
Interested in learning more about protein assay method?
Discover their applications, benefits, and explore case studies below.
-
Qualitative & Quantitative Analysis
-
Protein Modification Analysis
-
Molecular Interaction Analysis
-
Impurity Analysis
Qualitative & Quantitative Analysis Applications Assay list Benefits Purity Analysis SDS-PAGE - High acceptance
CE-SDS - High accuracy
- Automated
- High resolution
HPLC - Broad applicability
UPLC - Ultra-high pressure resistance
- Minimal delay volume
- Minimal sample residue
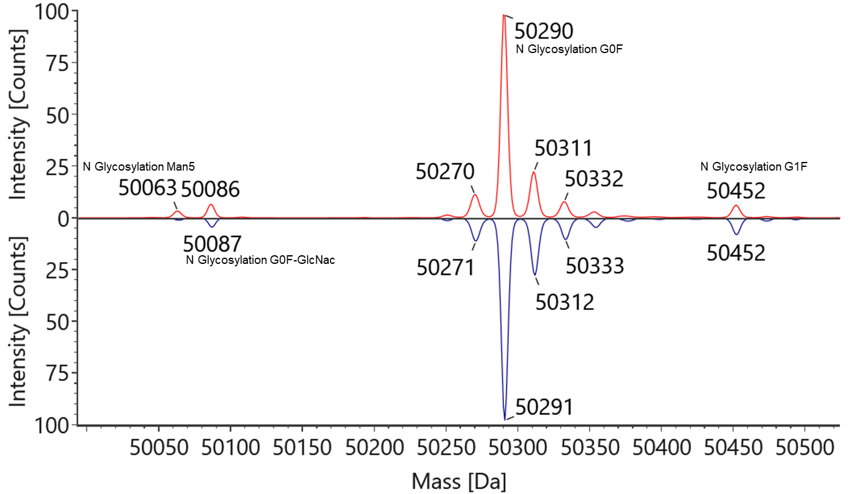
Routine molecular weight detection Non-deglycosylated detection:
- Intact mass
- Reduced mass
- Suitable for characterization of glycosylation modifications and protein assembly
N-glycan removal detection:
- De-glycosylated mass
- Reduced and de-glycosylated mass
- High intensity mass spectrometry
- More accurate determination of protein chain
- Suitable for bispecific antibody identification
Characterization of heavily glycosylated proteins Denatured N-glycan removal detection:
- De-glycosylated mass(denatured)
- Reduced and de-glycosylated mass(denatured)
- Suitable for the identification of complete molecular weight measurement of proteins with complex modifications.
Denatured N-glycan and O-glycan removal detection:
- De-O-glycosylated mass
- Reduced and de-O-glycosylated mass
- Simultaneous removal of N-glycans and O-glycans
- Elimination of their interference with protein detection
Characterization of complex formation under the native state - Native mass
- Mild detection conditions and native state preservation
- Suitable for analysis of protein complexes linked by non-covalent bonds
- Suitable for analyzing the degree of small protein aggregation
Characterization of the complete protein sequence - Sequence coverage
- Minimal impact of protein purity
- 100% sequence coverage
- in-gel sequence coverage
- Qualitative analysis of the band of interest
Characterization of protein N-terminal and C-terminal sequences - N/C-terminal sequence
- Confirm full protein expression
- Detect breaks in protein expression
- Identify N/C-terminal modifications
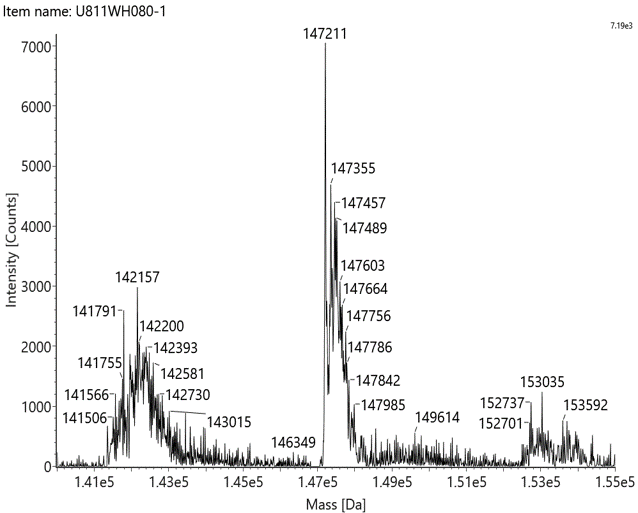
Case1 Native mass - BsAb – Identification of the non-covalently linked chain
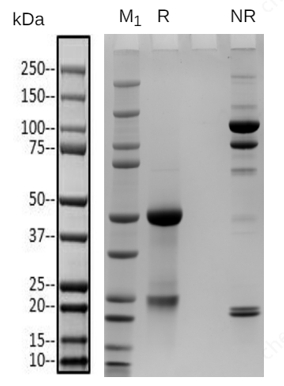
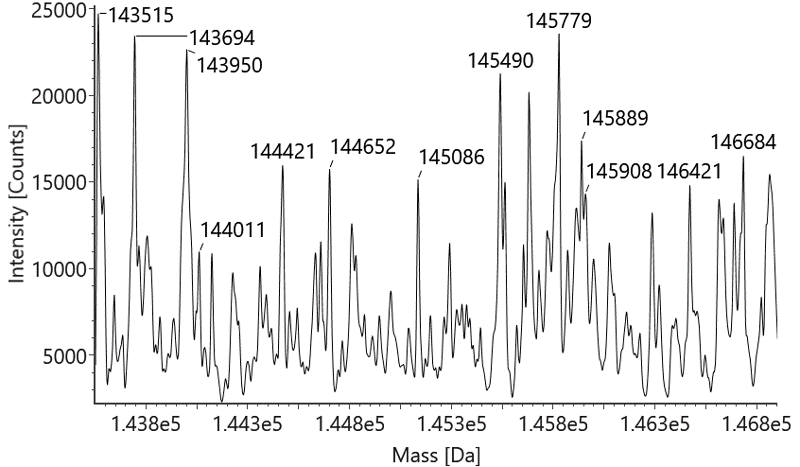
Native mass spectrometry is often used to identify the components of bispecific antibodies. The molecular weights of the marker bands in Fig 1A are 150 kDa, 120 kDa, 100 kDa, 74 kDa, and 23 kDa. Under denaturing conditions, the 150 kDa light chain was not identified by conventional mass spectrometry. This indicates that non-covalent interactions between proteins were disrupted under these conditions (Fig 1B). In contrast, native mass spectrometry reflected the original state of the proteins and successfully identified the light chain (Fig 1C).
Figure 1 SDS-PAGE and Mass analysis of BsAb1
A
B
C
Case 2 In-gel sequence coverage - Biotinylated protein – Identification for low concentration protein
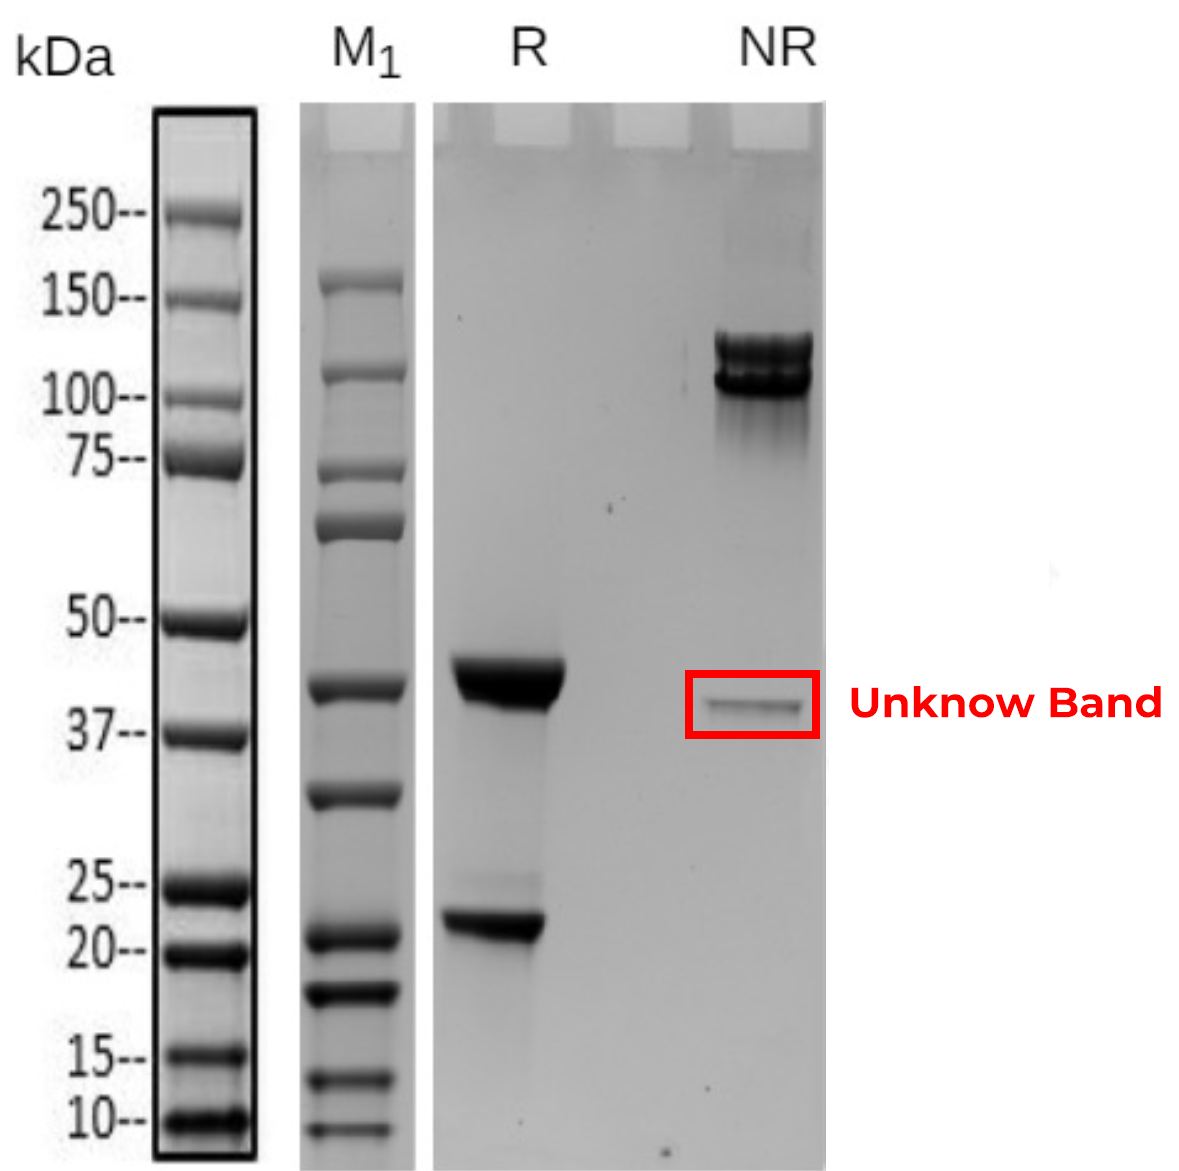
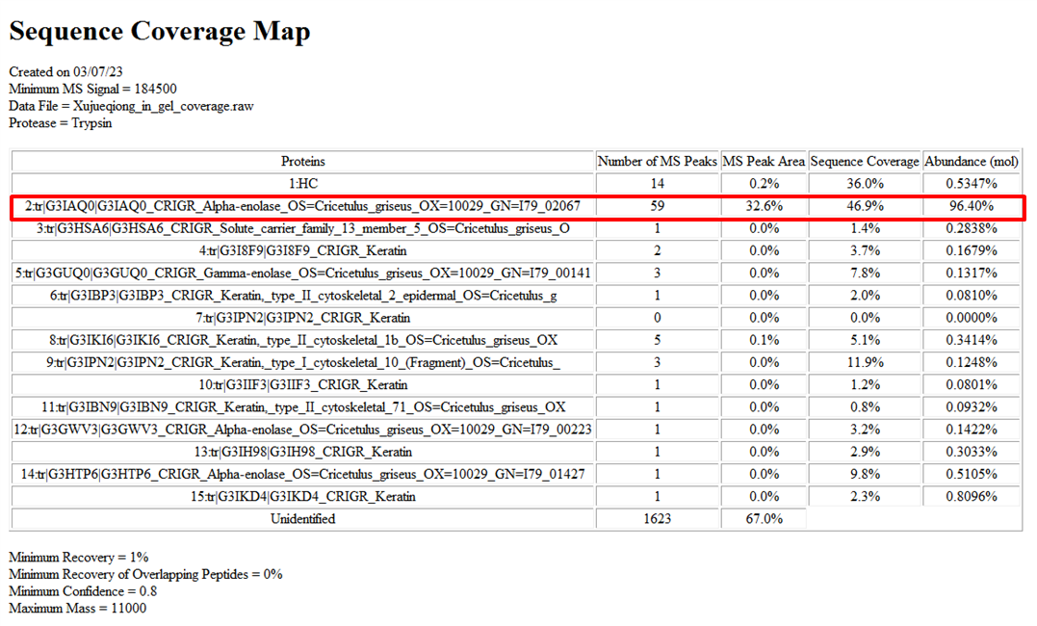
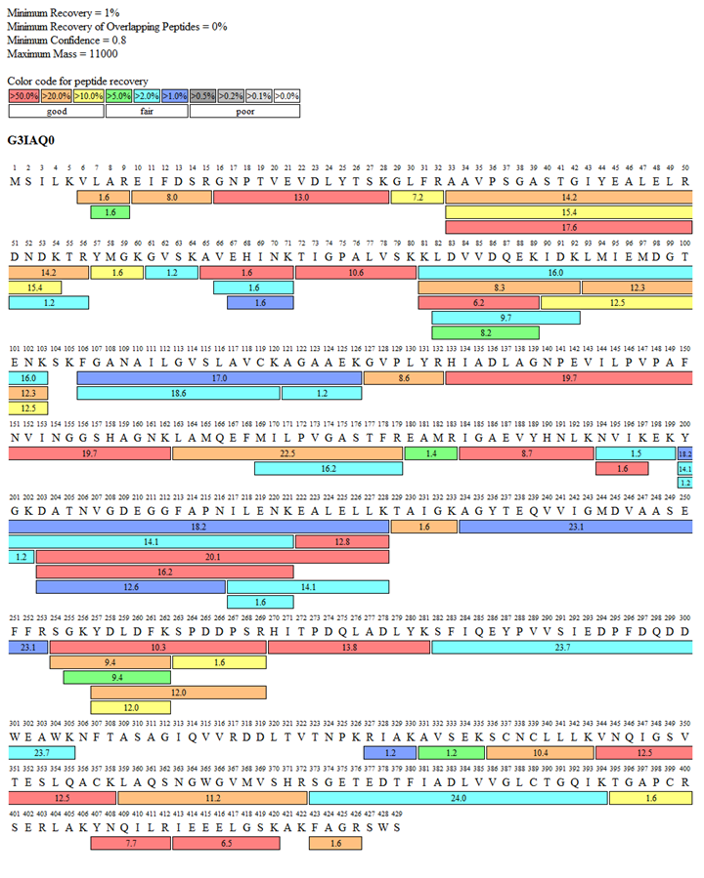
Detection of biotinylation efficiency for protein-1 was requested by the customer. However, its concentration is far below the requirement and it is difficult to concentrate. Nevertheless, the SDS-PAGE bands were relatively clear (Fig 1). By excising the target band from the gel and performing coverage analysis, the biotinylation efficiency was successfully identified (Fig 2, Tab 1).
Figure 1 SDS-PAGE of protein-1
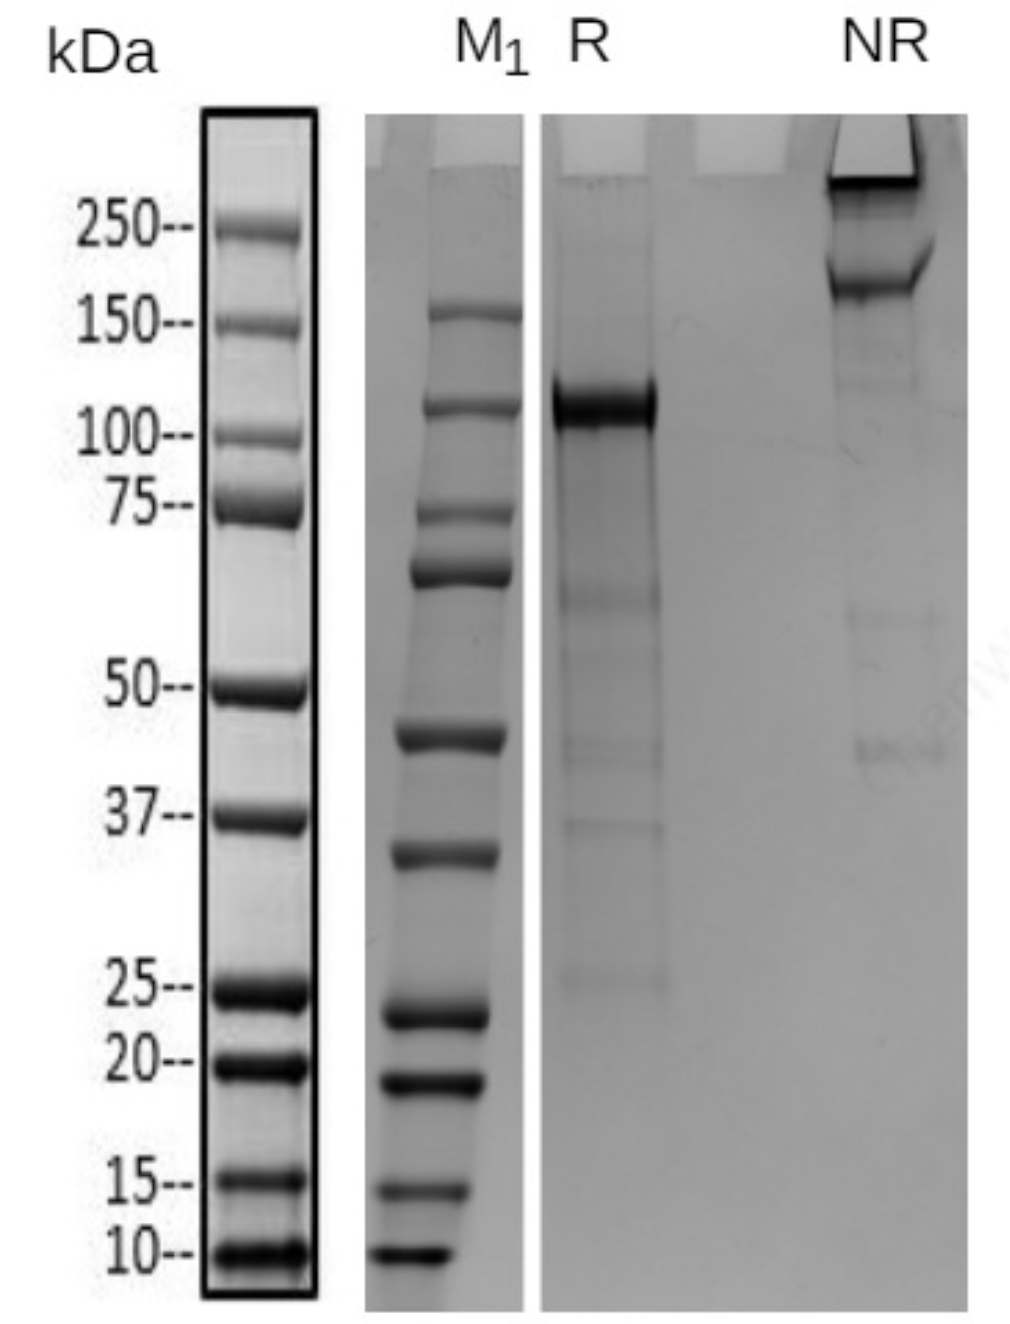
Figure 2 Fragment coverage map of protein-1
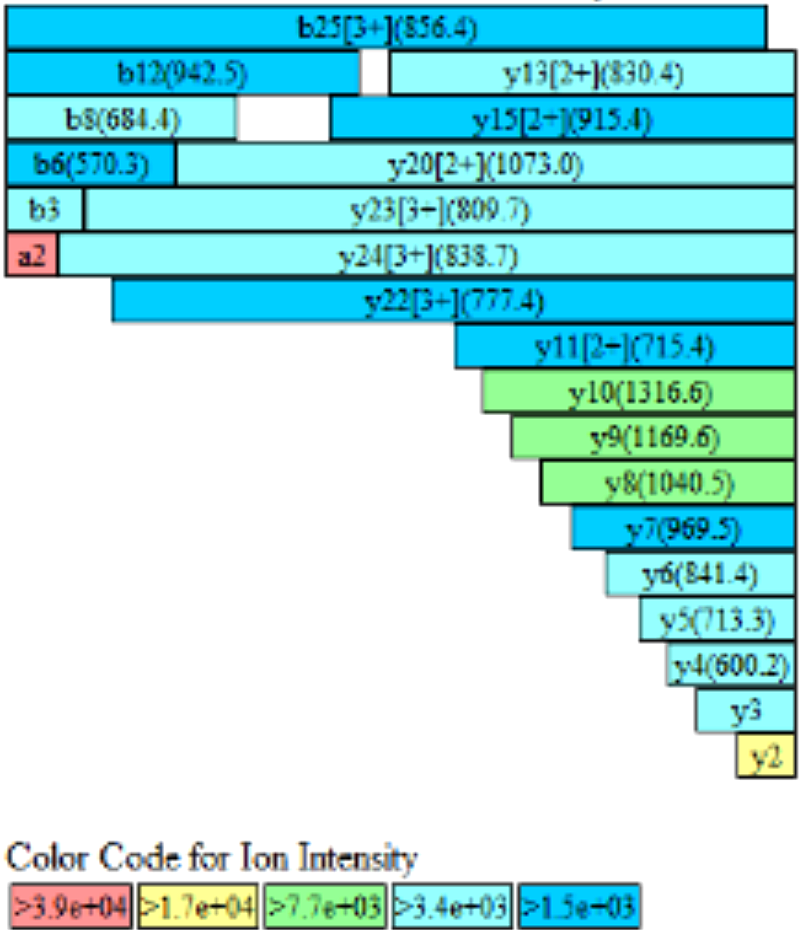
Table 1 Peptide coverage analysis of protein-1
Site Mod M/Z Charge St. Mono Mass Exp. Mono Mass Theo. △ ppm Biotinylation ratio % K1296 Biotinylation 980.803 3 2938. 385 2938.392 -2.36 99.3 Get in Touch
with GenScript Protein Analytical Service
-