


Figure 2. Comparison of GenScript PK kit and conventional RUO quantitative kit
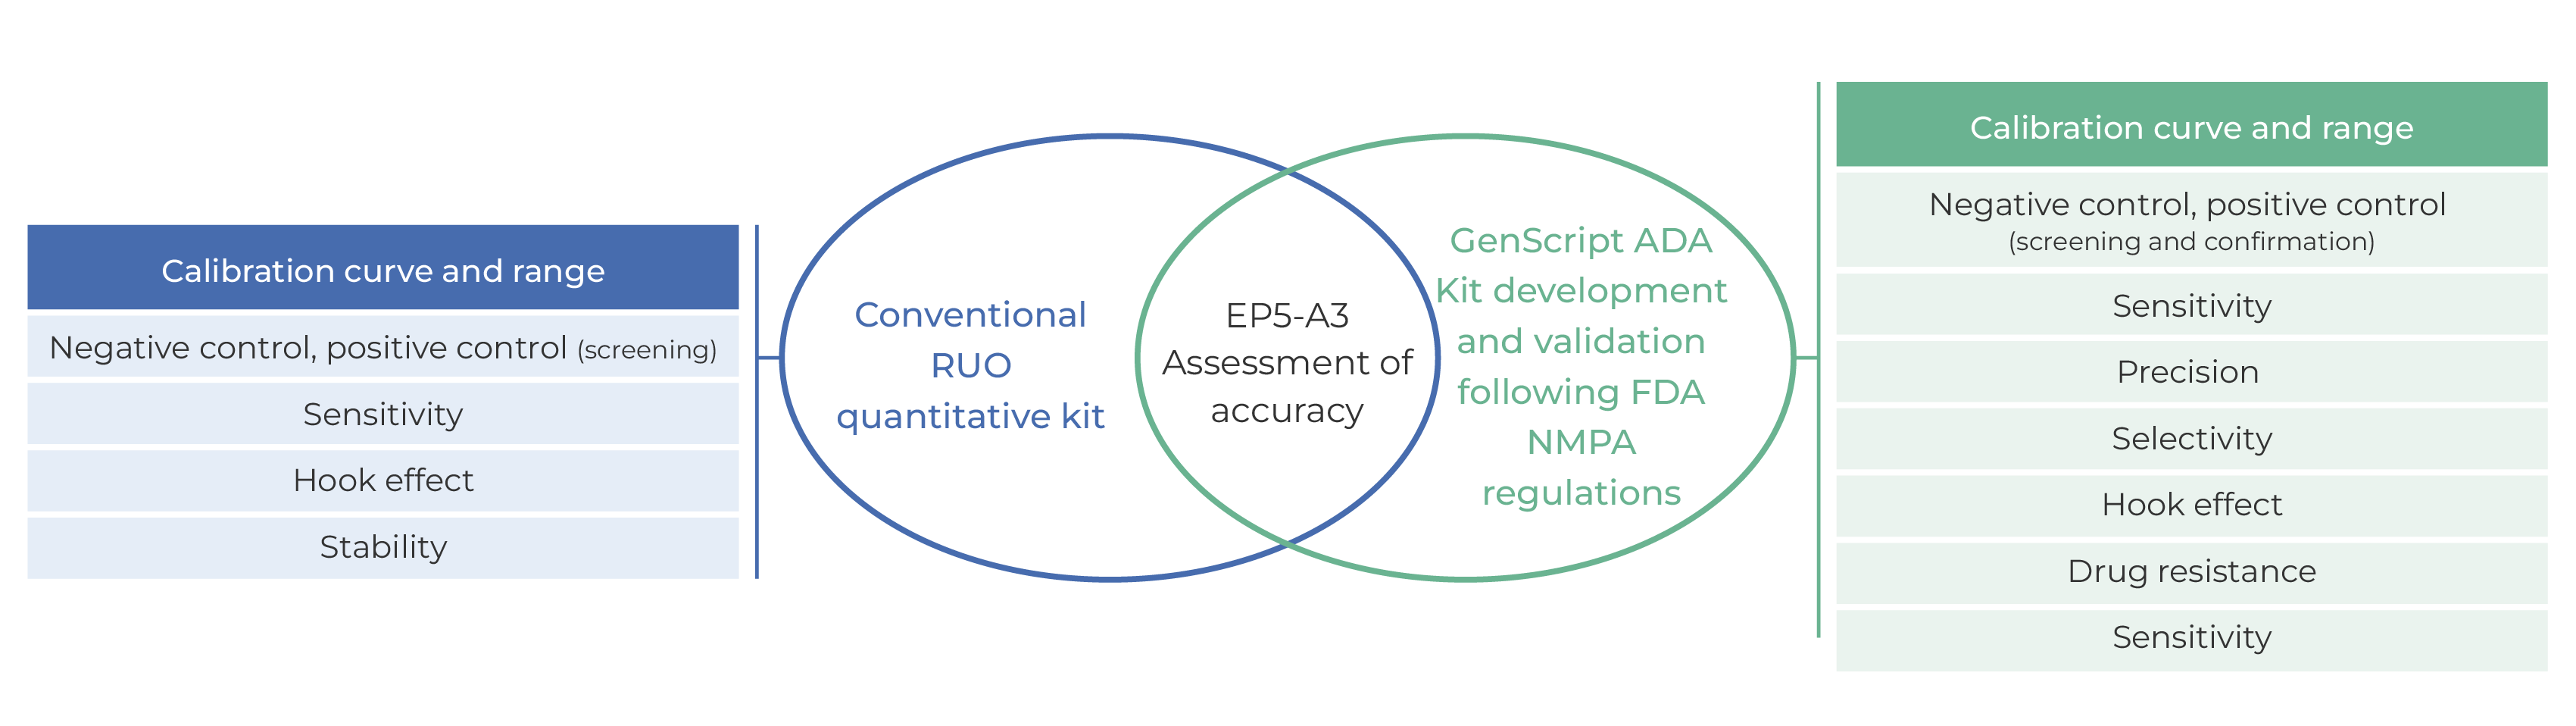
Figure 3. Comparison of GenScript ADA kit and conventional RUO quantitative kit
 Most Popular Products
 Antibodies
ELISA Kits
Antibodies
ELISA Kits
 Protein Electrophoresis and Blotting
Protein and Antibody Purification
Recombinant Proteins
Protein Electrophoresis and Blotting
Protein and Antibody Purification
Recombinant Proteins
 Molecular Biology
 Stable Cell Lines
 Cell Isolation and Activation
 Online Shop
Resources
Online Shop
Resources

Reports Available
Highly Accurate and Reliable
>60% Time Saving
{{ itemName }}
{{ category.name }}
{{ item.name }}
No Data

Figure 1. Development process of antibody drug
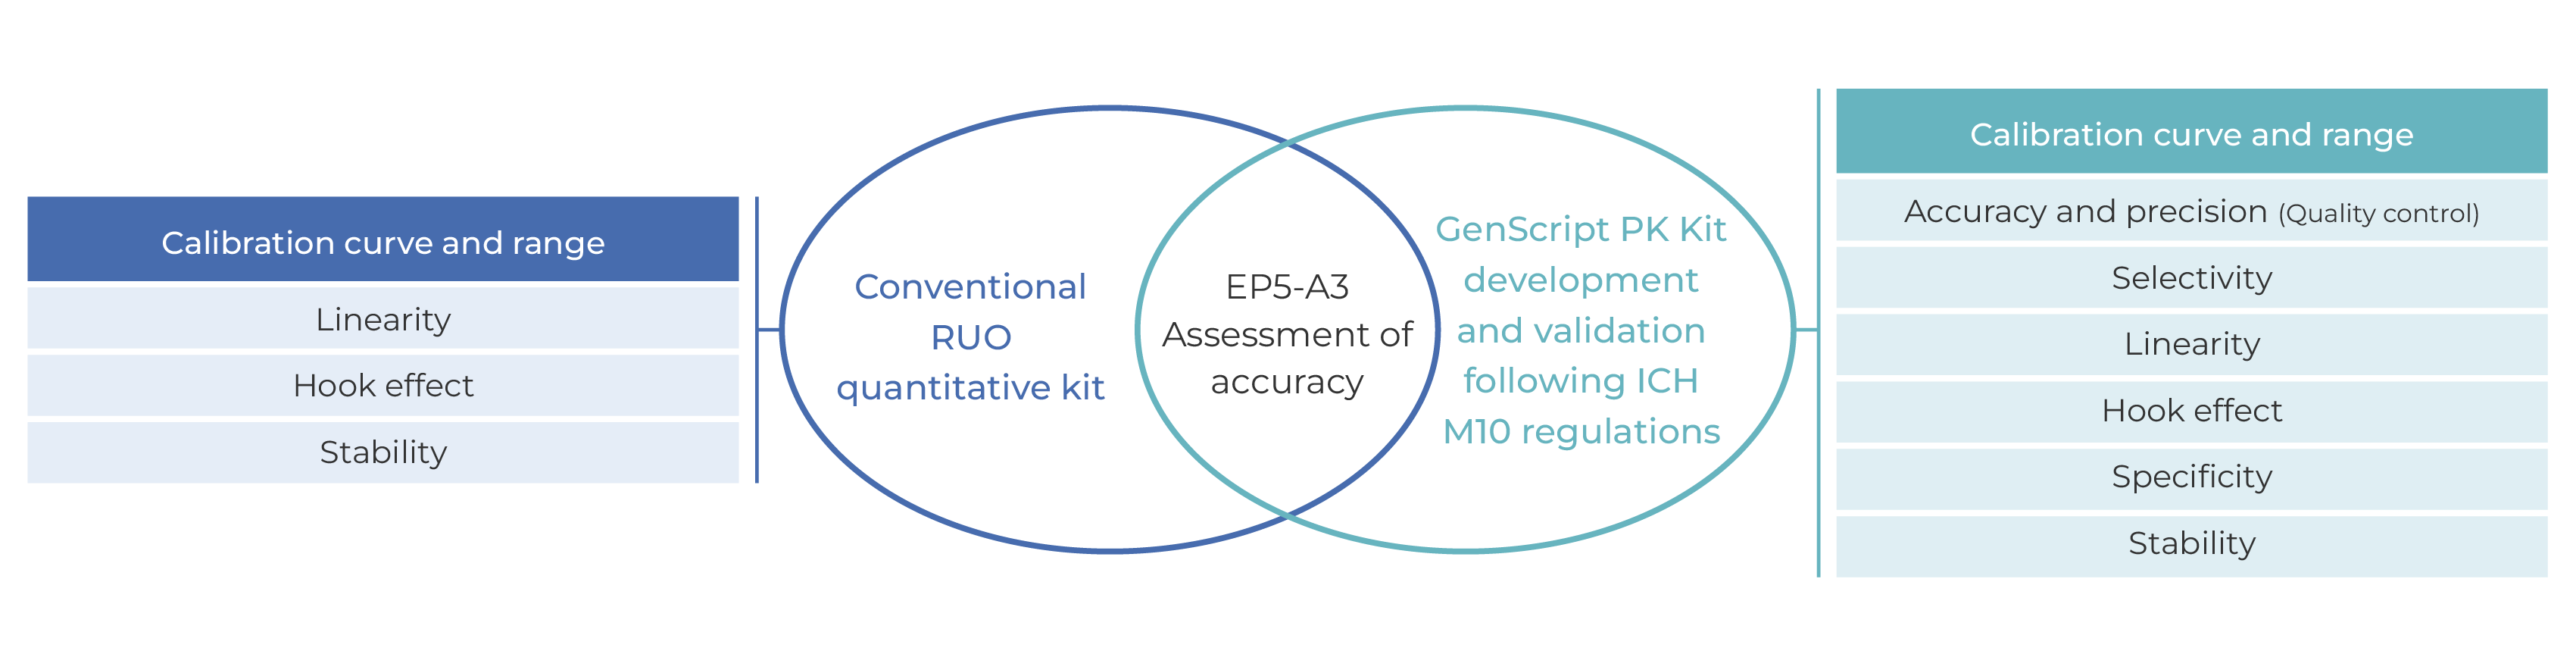
GenScript PK/ADA kits are developed and validated according to FDA and NMPA regulations, and accuracy of kits is evaluated according to the guidance document CLSI EP05-A3 to ensure its accuracy and reliability. GenScript PK/ADA kits can satisfy the needs of PK and ADA research during preclinical and clinical research.
Figure 2. Comparison of GenScript PK kit and conventional RUO quantitative kit
Figure 3. Comparison of GenScript ADA kit and conventional RUO quantitative kit

Figure 4. Pharmacokinetic ELISA kit

Figure 5. Immunogenicity ELISA kit (Bridging ELISA)

Figure 6. ADC Pharmacokinetics ELISA Kit

Figure 7. Standard curve with broad range and high sensitivity
Standard curve with 7 concentration points and range 160-2.5 ng/mL (MRD (Minimum Required Dilution) = concentration before 1:100 dilution), sensitivity: 5 ng/mL.

Figure 8. High selectivity
The dashed lines in the figure represent the critical lines of 80% and 120% precision.
HQC (High Quality Control) level selectivity: The precision of 100% blank individual matrices from different sources is 80.5% ~ 105%, and the precision is 0.9% ~ 6.4%.
LLOQ (Lower Limit of Quantification) level selectivity: The precision of 90% blank individual matrices from different sources is 95.8% ~ 116.8%, and the precision is 1.0% ~ 10.6%.
The blank individual matrices from different sources: The signal values of 10 blank individual matrices from different sources are all lower than the LLOQ signal value.

Figure 9. High Specificity
Human IgG4 (1600 ng/mL) was added. The accuracy of Pembrolizumab at ULOQ and LLOQ levels is 85.6% ~ 113.8%, and the precision is 2% ~ 5.1%.
Human IgG4 (160 ng/mL) was added. The accuracy of Pembrolizumab at ULOQ and LLOQ levels is 89.1% ~ 111.9%, and the precision is 0.4% ~ 0.5%.
Table 1. Intra-Assay and Inter-Assay Precision of L00968 Pembrolizumab Pharmacokinetics ELISA Kit
| Quality control |
Expected Pembrolizumab (ng/ml) | Intra-Assay (n=10) | Inter-Assay (n=30) | ||||
|---|---|---|---|---|---|---|---|
| Measured Pembrolizumab (ng/ml) | CV % | Accuracy % | Measured Pembrolizumab (ng/ml) | CV % | Accuracy % | ||
| P1 | 120 | 102.41 | 6.92 | 85.34 | 105.08 | 2.65 | 87.57 |
| P2 | 30 | 29.58 | 3.88 | 98.61 | 31.00 | 0.83 | 103.33 |
| P3 | 15 | 16.64 | 2.99 | 110.96 | 17.77 | 2.71 | 118.49 |
Precision of L00968: Intra-Assay CV% <7%, Inter-Assay CV% <3%.
Table 2. Hook Effect Analysis
| Pembrolizumab (ng/ml) | Absorbance (OD 450/630 nm) | CV % | ||
|---|---|---|---|---|
| Duplicate 1 | Duplicate 2 | Average | ||
| 15,000 | 5.845 | 5.323 | 5.584 | 6.60 |
| 1,500 | 5.881 | 5.611 | 5.746 | 3.33 |
| 750 | 5.505 | 5.583 | 5.544 | 0.99 |
The precision of the concentrations of three samples above ULOQ level is not affected by the hook effect (signal suppression caused by high concentration samples).
Table 3. Dilution Linearity Analysis
| Dilution Factor | Expected Pembrolizumab (ng/ml) | Measured Pembrolizumab (ng/ml) | CV % | Accuracy % |
|---|---|---|---|---|
| 1:2,000 | 7.5 | 8.496 | 0.28 | 113.28 |
| 1:1,000 | 15 | 17.215 | 2.27 | 114.77 |
| 1:100 | 15 | 15.406 | 1.21 | 102.71 |
| 1:50 | 15 | 15.597 | 2.92 | 103.98 |
Dilute the standard product by 4 different dilution ratios, after dilution factor correction, the accuracy of each diluted standard product is 102.7% ~114.8%, and the precision is 0.28% ~ 2.9%.

Figure 10. Rigorous positive control antibody screening
The sensitivity of 4 antibodies is validated to be greater than 20 ng/mL through screening experiments, and results show that all 4 antibodies can be used as positive control antibodies by further validation experiments. Based on the screening and validation results, the antibody with the highest sensitivity is selected as the final positive control antibody for ELISA kit.

Figure 11. Ideal standard curve
Set 6 concentration points, standard curve range 50-0.78 ng/mL (MRD = concentration before 1:100 dilution), sensitivity: 1.56 ng/mL.

Figure 12. MRD analysis
When MRD=1:5, the signal value of the sample prepared with biological matrix is closest to the signal value of the sample prepared with sample diluent.

Figure 13. High selectivity
The dashed line in the figure is the screening critical value line.
LQC (Low Quality Control) level selectivity: The precision of 87% blank individual matrices from different sources is 0.2% ~ 8.5%, and signal value is not lower than the screening critical value.
Blank level selectivity: The precision of 87% blank individual matrices from different sources is 0.6% ~ 14.3%, and signal value is lower than the screening critical value.

Figure 14. Hook effect analysis
As the concentration of Anti-Pembrolizumab increases, the signal value increases. The signal value of high-concentration samples is higher than the signal value of the high point of the standard curve, and there is no significant signal suppression phenomenon. No hook effect is observed within the tested concentration range.
Table 4. Intra-Assay and Inter-Assay Precision of L00971 Immunogenicity ELSIA kit (Bridging ELISA)
| Samples | Expected Anti-Pembrolizumab (ng/mL) | Intra-Assay (n=10) | Inter-Assay (n=30) | ||||
|---|---|---|---|---|---|---|---|
| Measured Anti-Pembrolizumab (ng/mL) | CV % | Accuracy % | Measured Anti-Pembrolizumab (ng/mL) | CV % | Accuracy % | ||
| P1 | 50 | 49.27 | 3.26 | 98.54 | 50.96 | 3.51 | 102.07 |
| P2 | 7.5 | 7.75 | 4.27 | 103.37 | 8.22 | 4.17 | 110.32 |
| P3 | 2.5 | 2.15 | 7.27 | 85.81 | 2.39 | 8.07 | 95.40 |
Precision of L00971: Intra-Assay CV% <8%, Inter-Assay CV% <9%.


